In This Topic
Nevron Map for Reporting Services is a custom report item. In order to better understand how to work with it and bind it to data you should have a general understanding of custom report items and the data model they use.
Each custom report item has a design model and runtime state. The design model defines how it merges with the actual data, which is provided at runtime. The runtime state represents the report item when the data has been processed by reporting services and merged with the design model of the item. Custom report items are similar to the Matrix report item. Custom report items are composed by hierarchically organized row and column data groupings (see Custom Report Items Processing for a complete discussion).
Because not every Matrix model is suitable for a map, Nevron Map for Reporting Services uses a simplified model, which is better suited for this purpose. Figure 1 illustrates the design model of the map:
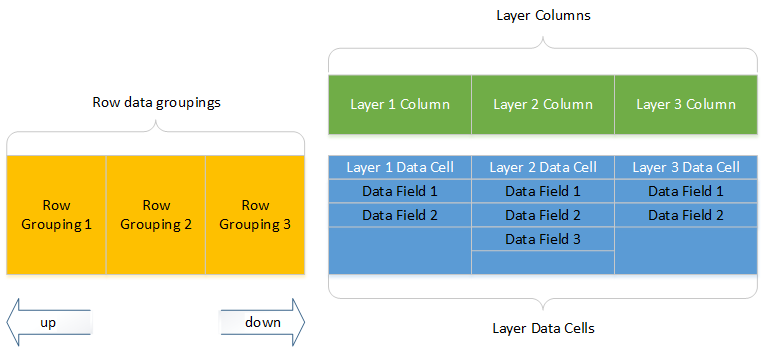
Figure 1. The Map Data model
There are two types of data groupings - rows and columns. Row data groupings define how the data cells expand in the row direction. The layer column data groupings are static and are created for each map layer that you add or remove from the visual interface.
There is a data cell associated with each map layer. The data cell stores a custom collection of data fields (note that in SSRS each data cell can have multiple properties). When the report item is processed it generates a data table for each layer. The data tables of all layers have the same amount of records, as defined by the row data groupings. Each data table however can have arbitrary data fields, as defined by each data cell properties.
To show that data table on a map, you need to bind it to the table that comes along with the map. Each ESRI shapefile (layer) has an associated table that describes the shapes contained inside it. The binding of the map data to the layer data table is performed by the map binding fields, where you generally specify what column from the map data should be equal to the layer data table (more technically speaking performs a Left Outer Join).
Examples
Too complex - lets see some samples. Imagine that you have a data set in which you have data for the states of USA:
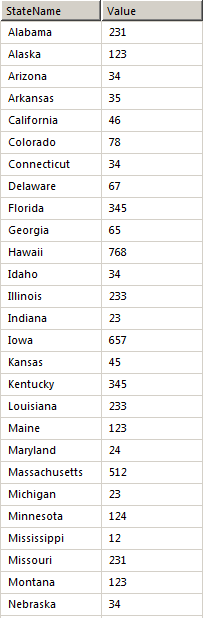
Figure 2. Sample data set (records past Nebraska are excluded from the image for simplicity).
First consider a Matrix report item at design and runtime:
Matrix1 Design Time:
Matrix1 Runtime:

Now lets suppose that we want to build a choropleth map that displays the value for each USA state. To do that you need to first replicate this sample matrix in the context of Nevron Map for SSRS like this:
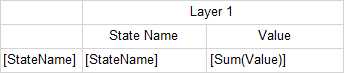
1. Drag and drop the StateName data field to the row data groupings panel (i.e. group the data by StateName):

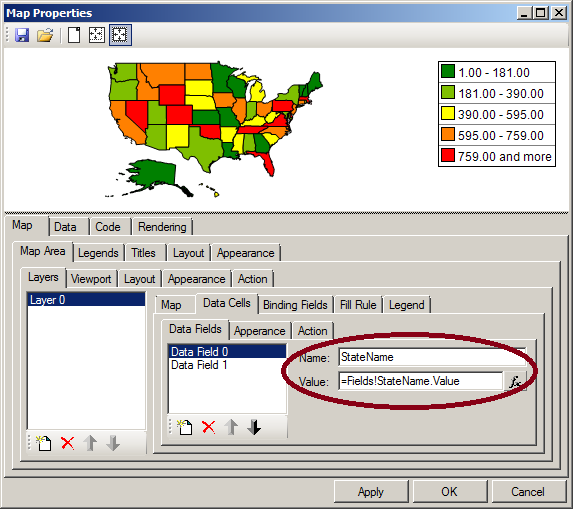
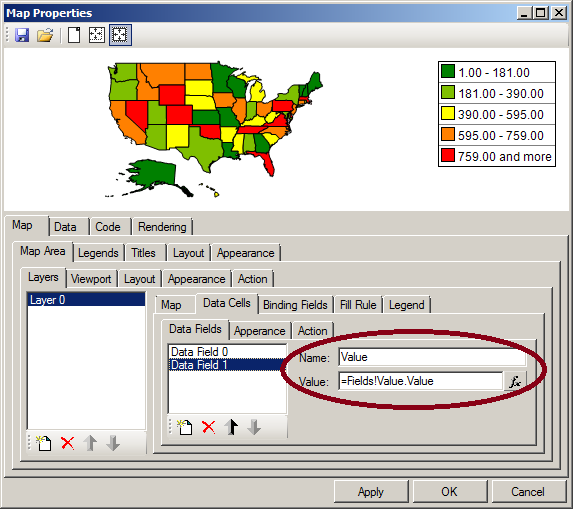
2. Define the map data fields like this:
First data field with name StateName and value: =Fields!StateName.Value
Second data field with name Value and value:=Sum(Fields!Value.Value)
At this point when the map is rendered the layer data table will have a StateName column and a Value column. To bind that data table to map data, you need to the following:
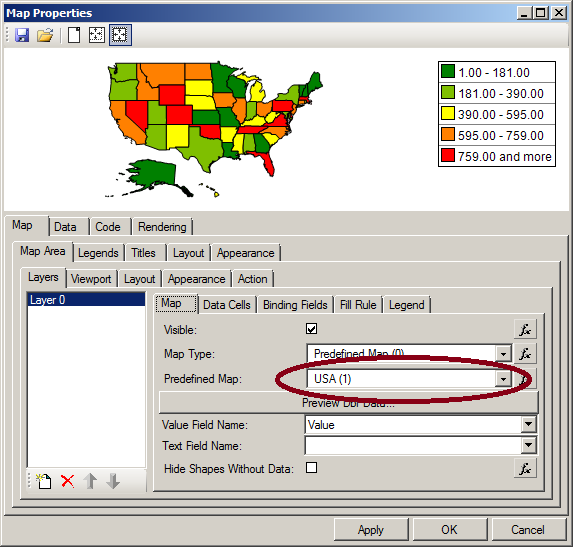
1. Select the USA map as the layer predefined map to display:
Note that the USA predefined table comes along with a table that has a STATE_NAME column, that defines the name of each state polygon.
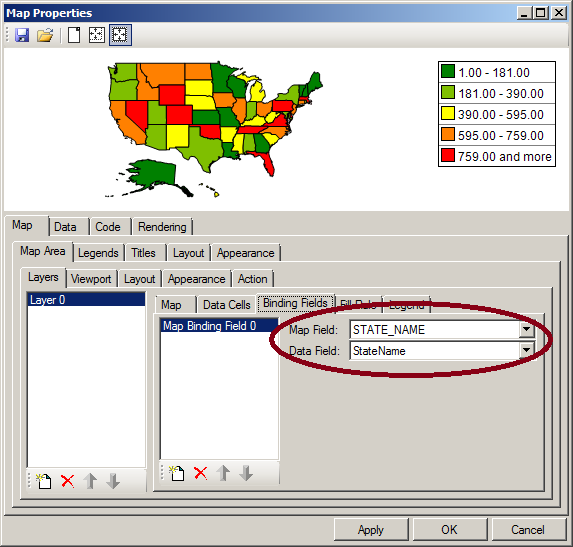
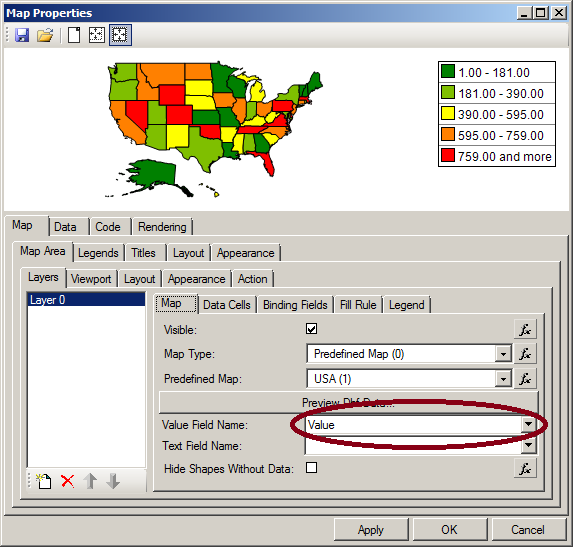
2. Create one binding field that maps the STATE_NAME map column to the StateName data column.
3. Set the Value Field Name to Value
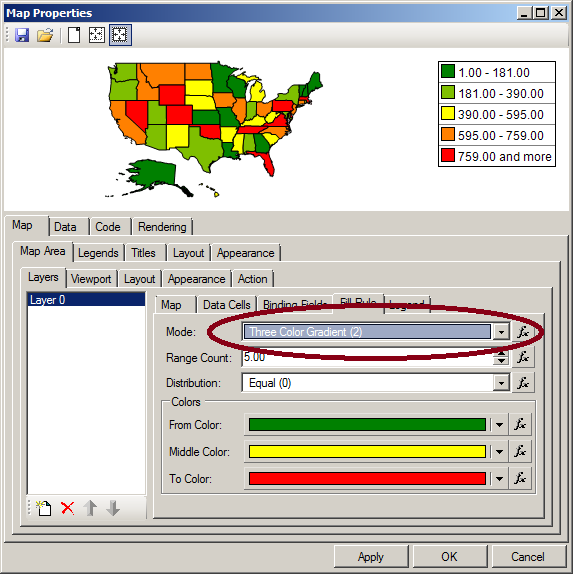
4. Set the map fill rule to three color gradient.
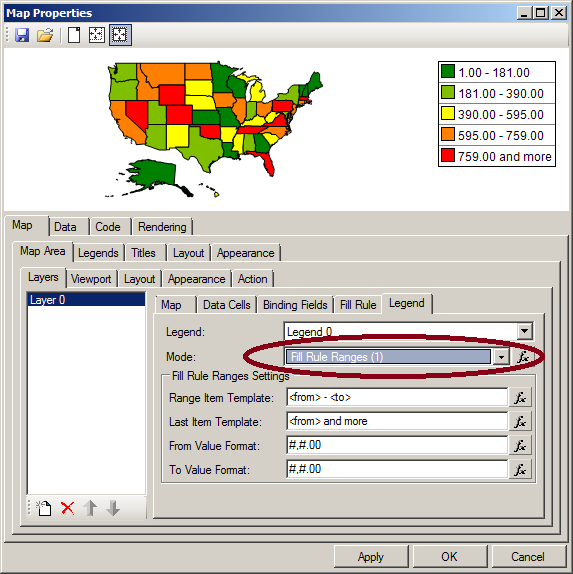
5. Set the map legend mode to Fill Rule Ranges.
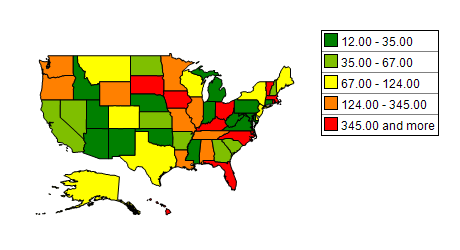
Now you have a choropleth map that display the value associated with each USA state. When you run the report you will get this result: